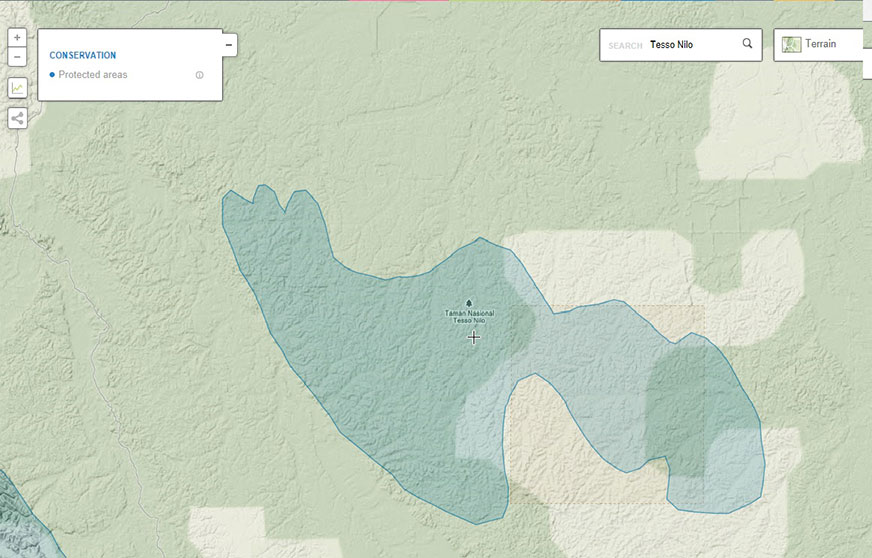
Explain to students that they will quantify tree loss in Tesso Nilo National Park. You will need to go back to the Global Forest Watch site and get students to this map:
- Go to: Maps
- Search: Tesso Nilo
- Change from “Gray Scale” to “Terrain”
- Go to “Forest Change” and click “None”
- Go to “Conservation” and click “Protected”
- Go to the timeline across the bottom of the page and move the green band back to 2001. Click, hold and drag the green box with a block dot that is at 2013, back to 2001.
- Now you will see the outline of Tesso Nilo. Students will click the “Draw” tool and outline Tesso Nilo National Park. (This will take a minute or two.) Click and let go at each point you want to make even the slightest change in direction. Students can have as many points around the perimeter as needed.
*SPECIAL NOTE* – Before you click “DONE”, move any points that you want to correct, because once you click “DONE” you cannot go back and edit without starting over. - Calculation totals will generate on the right side of the screen. (These will vary because of outline variances)
- Students will move the timeline icons (both the left and right so that we can look specifically at 2010 to 2013. Their data will be in the box at the right of your screen. Students will answer the following questions below.
- What is the total area selected in Hectares and in Acres?
- What is the total loss between 2010-2013 in both hectares and acres?
- What is the total gain between 2010-2013 in both hectares and acres?
- What is the percent lost from 2001-2013?
- How does a protected national park lose so much natural forest? What does this tell you about deforestation in Tesso Nilo?
- How does this loss of tree cover effect wildlife?
- How does this loss of tree cover effect indigenous communities who live within Tesso Nilo?
- How does this loss of tree cover effect greenhouse gas emissions?


